Do you know your true order profitability?
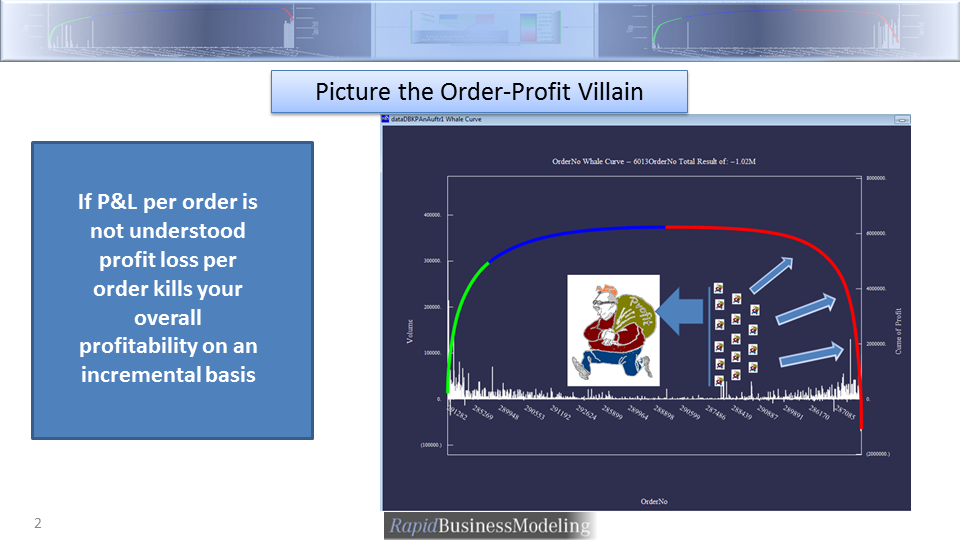
The best performance measurement for your true enterprise profitability is based on a so called WhaleCurve. A WhaleCurve can show customer, products, orders, channel , activity, or any other desired dimensional profitability. The example of a Order WhaleCurve is shown below.
The x-axis shows the Order, the left y-axis shows your sales volume reflecting the bars, the right y-axis shows the cumulative order profitability based on the green, blue and red line. The green blue cut point depicts where 80% of the total profitability was made on how many orders (very often 20% of the orders make 80% of your profit). The blue regime shows those orders make you 80% to 100% profit. The red regime shows which orders are unprofitable.Here one can see how about 50 % of the orders taken kill the overall profitability dramatically. The overall shape of the curve also depicts your dependency from your orders / customers.
Our dynamic WhaleCurve application enables you to have immediate access to your customer’s P&L the product profitability and details on revenue, costs, volume all at your fingertip.
